Google continues to push the boundaries of AI integration with its latest update to Gemini, the AI-powered assistant for Google Workspace. In a recent announcement on the Workspace blog, Google revealed that Gemini now has advanced capabilities to analyze data, identify trends, and create static charts directly within Google Sheets. This update is set to revolutionize how users interact with spreadsheets, making data analysis faster, smarter, and more accessible.
Whether you’re a business professional, data analyst, or casual spreadsheet user, these new features can save you time and effort while unlocking deeper insights from your data. Let’s dive into what’s new, how it works, and how you can make the most of Gemini in Google Sheets.
What’s New with Gemini in Google Sheets?
Gemini’s latest update introduces two powerful features:
- Data Trend Analysis: Gemini can now analyze your data and provide insights into trends, patterns, and anomalies. For example, you can ask Gemini to identify sales trends over the past year or highlight seasonal fluctuations in your data.
- Static Chart Creation: Gemini can generate visualizations, such as bar charts, line graphs, and pie charts, based on your data. These charts can be inserted directly into your spreadsheet as static images.
These features are designed to simplify complex data analysis tasks, allowing users to focus on decision-making rather than manual data manipulation.
How Does Gemini Work in Google Sheets?
Gemini leverages advanced AI and machine learning to perform these tasks. Here’s a breakdown of how it works:
- Python Code Execution: For complex requests, Gemini creates and runs Python code behind the scenes to analyze your data and generate insights.
- Spreadsheet Formulas: For simpler tasks, Gemini uses standard spreadsheet formulas to provide quick answers.
- Static Visualizations: The charts created by Gemini are static images, meaning they won’t update automatically when your data changes. You’ll need to request a new visualization if your dataset is updated.
This combination of AI and traditional spreadsheet tools makes Gemini a versatile assistant for both novice and advanced users.
Who Can Access These Features?
The new Gemini features are rolling out to most Google Workspace plans, including:
- Google Workspace Business Starter, Standard, and Plus
- Enterprise Essentials, Standard, and Plus
- Google One AI Premium Plan ($19.99 per month)
The update is expected to be fully available by February 20th, so keep an eye out for it in your Google Sheets interface.
How to Use Gemini’s New Features in Google Sheets
Here’s a step-by-step guide to making the most of Gemini’s new capabilities:
- Open Your Spreadsheet: Launch Google Sheets and open the spreadsheet you want to analyze.
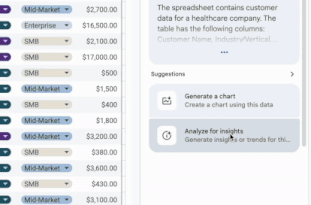
- Ask Gemini a Question: In the Gemini sidebar, type a question or request related to your data. For example:
- “What are the sales trends for Q4?”
- “Create a bar chart showing monthly revenue.”
- Review the Results: Gemini will analyze your data and provide insights or generate a chart.
- Insert the Chart: If Gemini creates a visualization, you can insert it into your spreadsheet as a static image.
- Refine Your Request: If the results aren’t what you expected, try rephrasing your question or providing more specific details.
Limitations and Best Practices
While Gemini’s new features are impressive, there are a few limitations to keep in mind:
- Static Charts: Since the charts are static images, they won’t update automatically when your data changes. For frequently updated datasets, consider creating traditional charts that dynamically reflect changes.
- Data Accuracy: Gemini’s analysis depends on the quality of your data. Inconsistent formatting, missing values, or unclear prompts can affect the accuracy of its results.
- Specific Prompts: To get the best results, be as specific as possible when asking Gemini to analyze your data. For example, instead of asking, “Show me trends,” try, “What are the monthly sales trends for Product X in 2023?”
Why This Update Matters
Gemini’s new features are more than just a convenience—they represent a significant step forward in making data analysis accessible to everyone. Here’s why this update is a game-changer:
- Time Savings: Automating data analysis and visualization tasks frees up time for more strategic work.
- Improved Decision-Making: With faster access to insights, users can make data-driven decisions more efficiently.
- Accessibility: Even users with limited technical skills can now perform advanced data analysis with ease.
How Gemini Compares to Traditional Data Analysis Tools
While traditional tools like Excel or specialized data analysis software offer robust features, Gemini’s AI-powered capabilities bring a new level of simplicity and speed. Here’s how they stack up:
| Feature | Gemini in Google Sheets | Traditional Tools |
|---|---|---|
| Ease of Use | Intuitive, AI-driven interface | Steeper learning curve |
| Speed | Instant insights and visualizations | Manual data manipulation |
| Flexibility | Limited to static charts | Dynamic, customizable charts |
| Accessibility | Available to most Workspace users | Often requires specialized software |
Final Thoughts
Google’s latest update to Gemini in Google Sheets is a testament to the growing role of AI in everyday productivity tools. By automating data analysis and visualization, Gemini empowers users to work smarter, not harder. Whether you’re analyzing sales data, tracking project progress, or exploring trends, these new features can help you unlock valuable insights with minimal effort.
As Gemini continues to evolve, it’s clear that AI will play an increasingly important role in how we interact with data. If you’re a Google Workspace user, be sure to explore these new capabilities and see how they can transform your workflow.